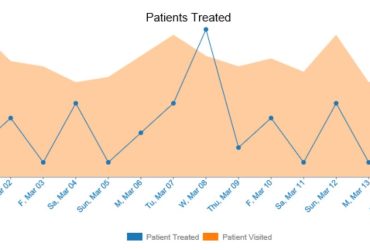
The line graph is commonly used to display data over time. It is a popular choice for presenting trends and changes. Line graphs are frequently utilized to illustrate data trends over time. By plotting points on a Cartesian plane and connecting them with lines, line graphs show the progression of data over a specific period. This type of graph is particularly useful for displaying changes in variables such as temperature, population, sales figures, or stock prices. Read more about Which Graph is Commonly Used to Display Data Over Time? Unveiling the Perfect Time-Series Visualization …

Trends Magazine
Discover Today's Trends